

Infographics: Creating credible data
Today, infographics are a new way to deliver information quickly and efficiently in a digital world where people’s attention spans move faster than ever. But what makes people stop and look at infographics? What builds credibility between the information and how it’s displayed? By comparing infographics with the core concepts of behavioral economics, we will answer these questions.
First, we must understand what behavioral economics is. Ellen Lupton defines it as the study of how humans make decisions, using design elements like hierarchy, typography, and large numbers and icons as nudges to get people interested in the product.
Infographic 1:
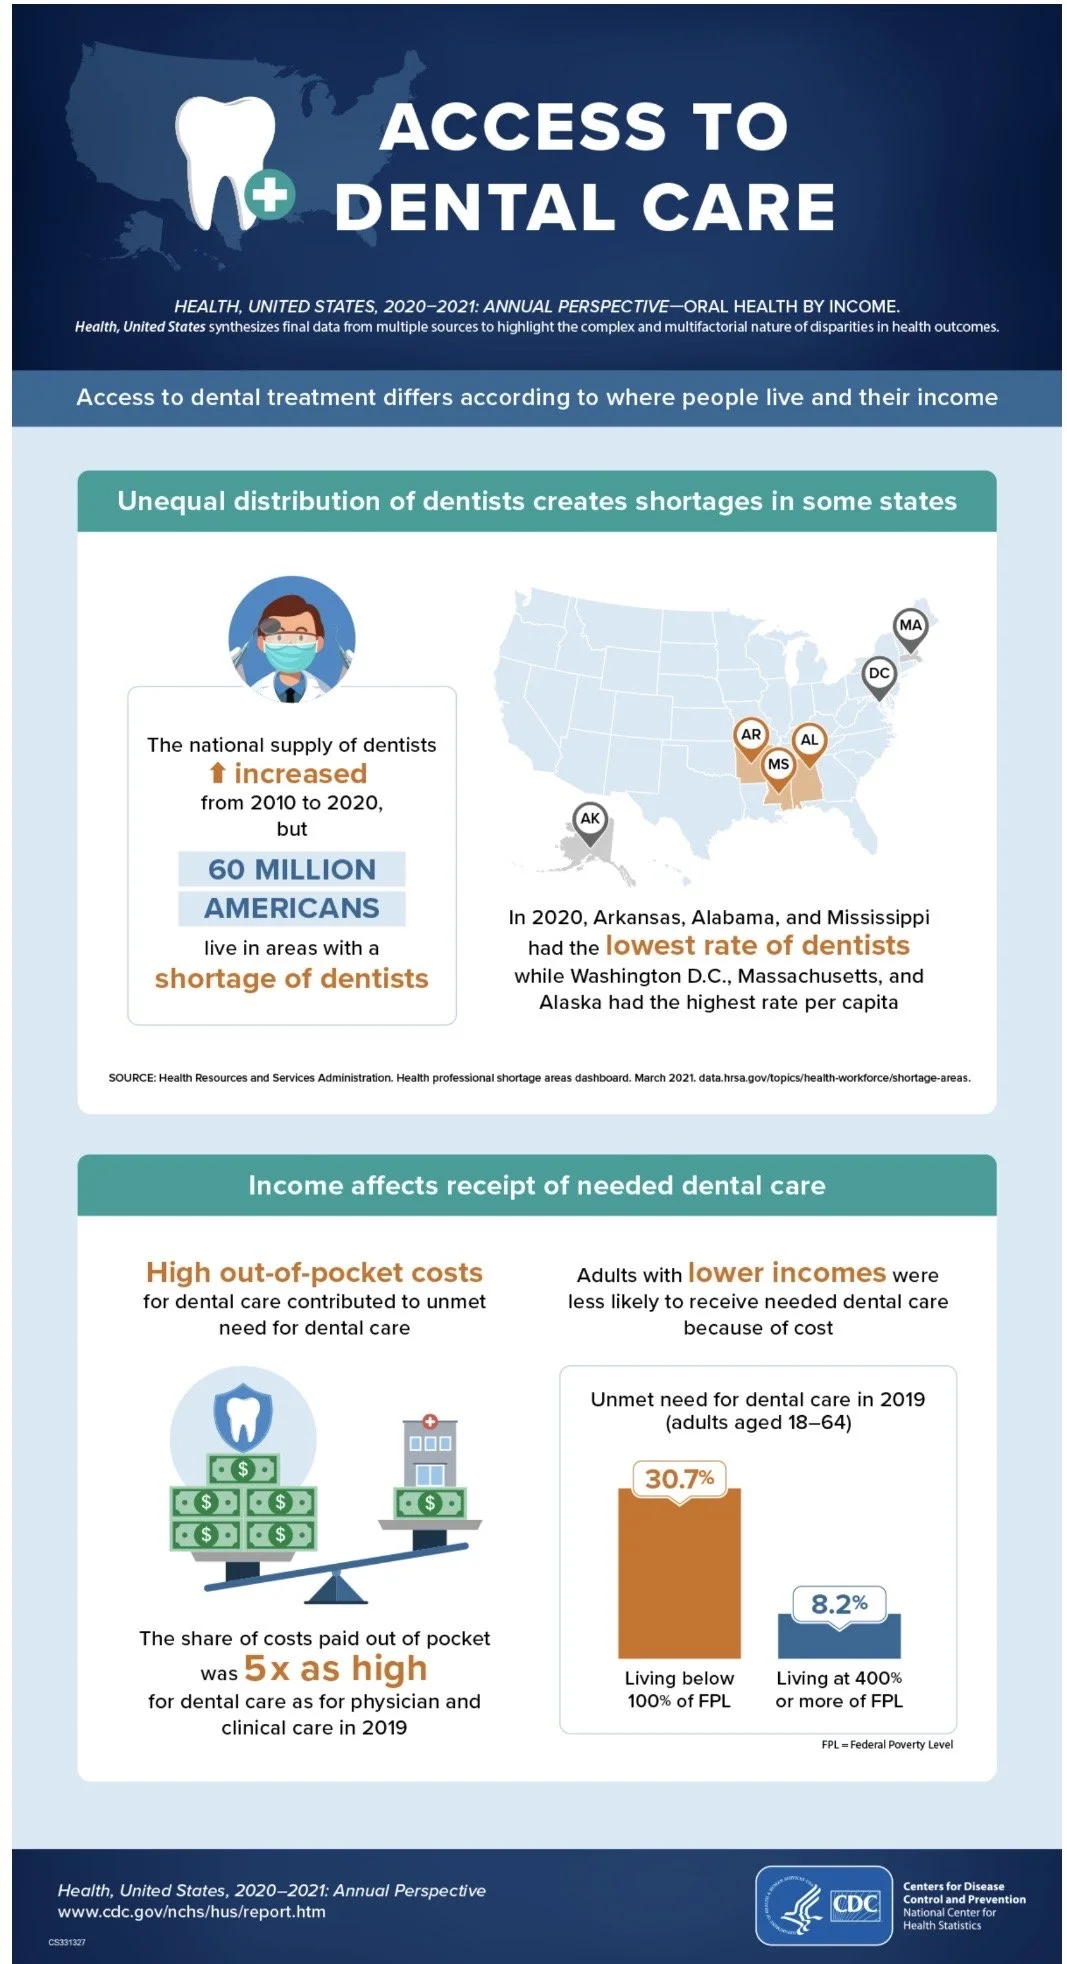
In this infographic, hierarchy, typography, and icons are used in behavioral economics to grab the reader's attention. The hierarchy places the title at the top, followed by the most important, general information and data, then more detailed data. Typography also plays a role in behavioral economics, as bolder words help readers quickly grasp information and data. Icons also serve as attention grabbers, keeping the reader's eye on the infographic.
Infographic 2:
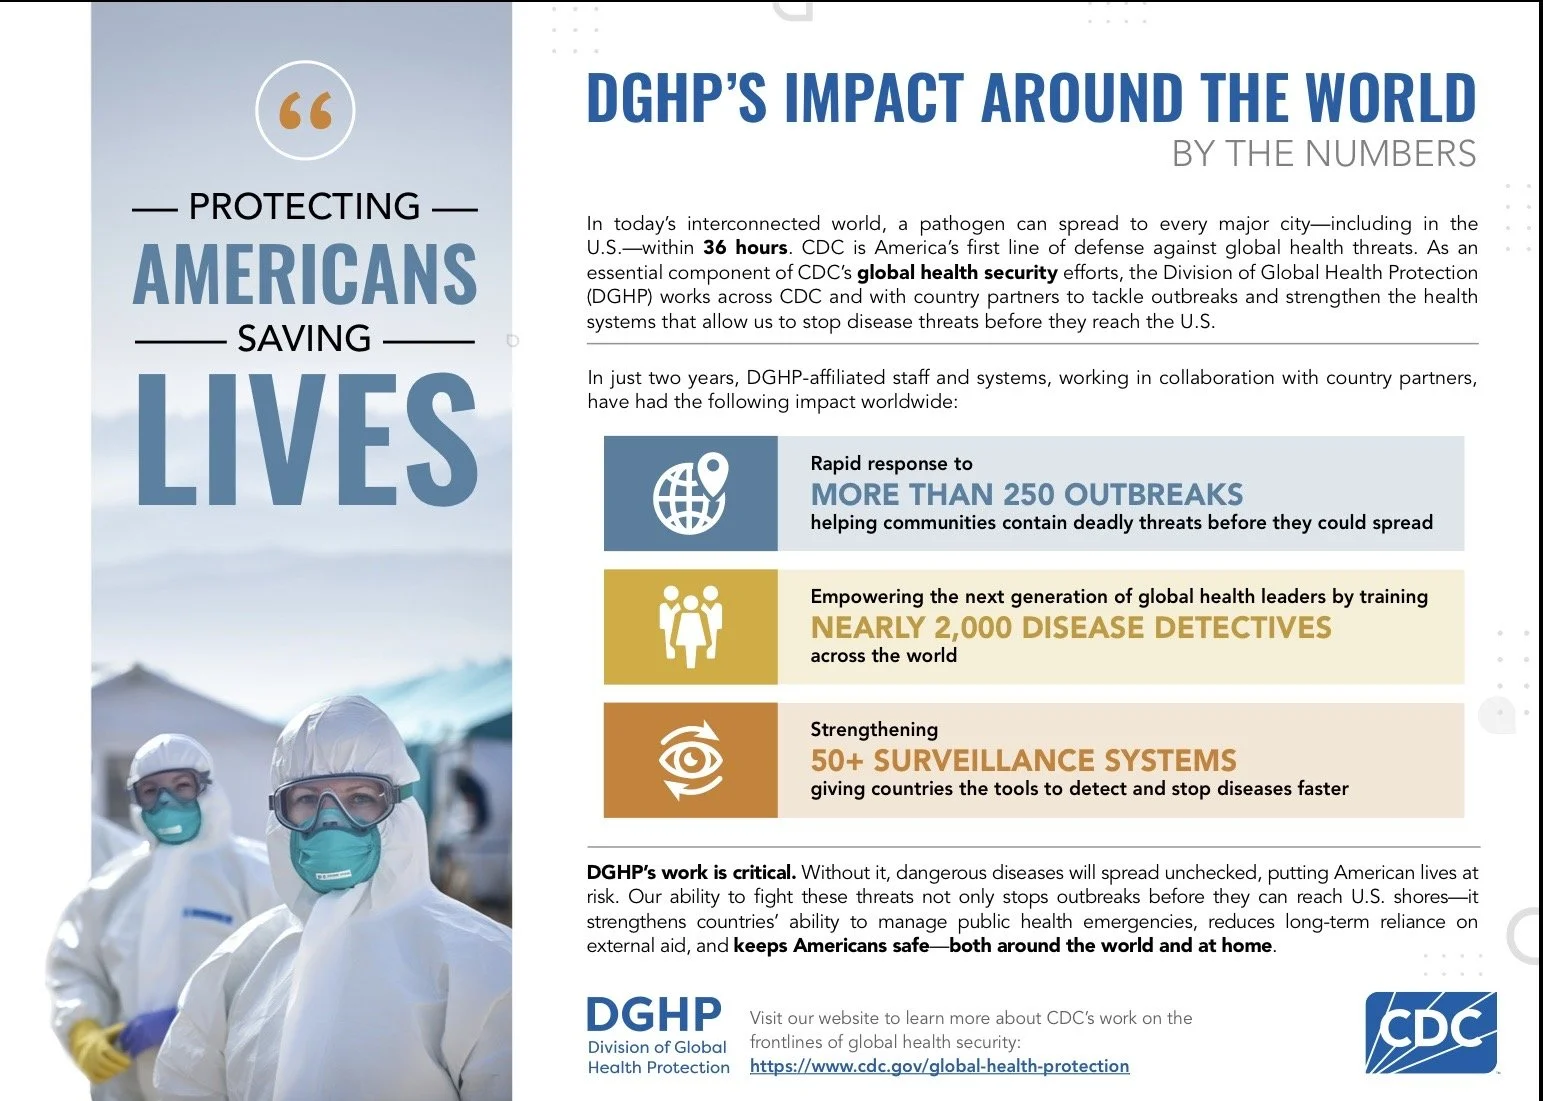
This infographic uses icons, images and numbers to grab readers' attention. The icons and numbers quickly display data and make it easy for the viewer to digest. Typography is also used similarly to the previous infographics, using bold font to emphasize key data for the reader to remember and comprehend easier and quicker.
Infographic 3
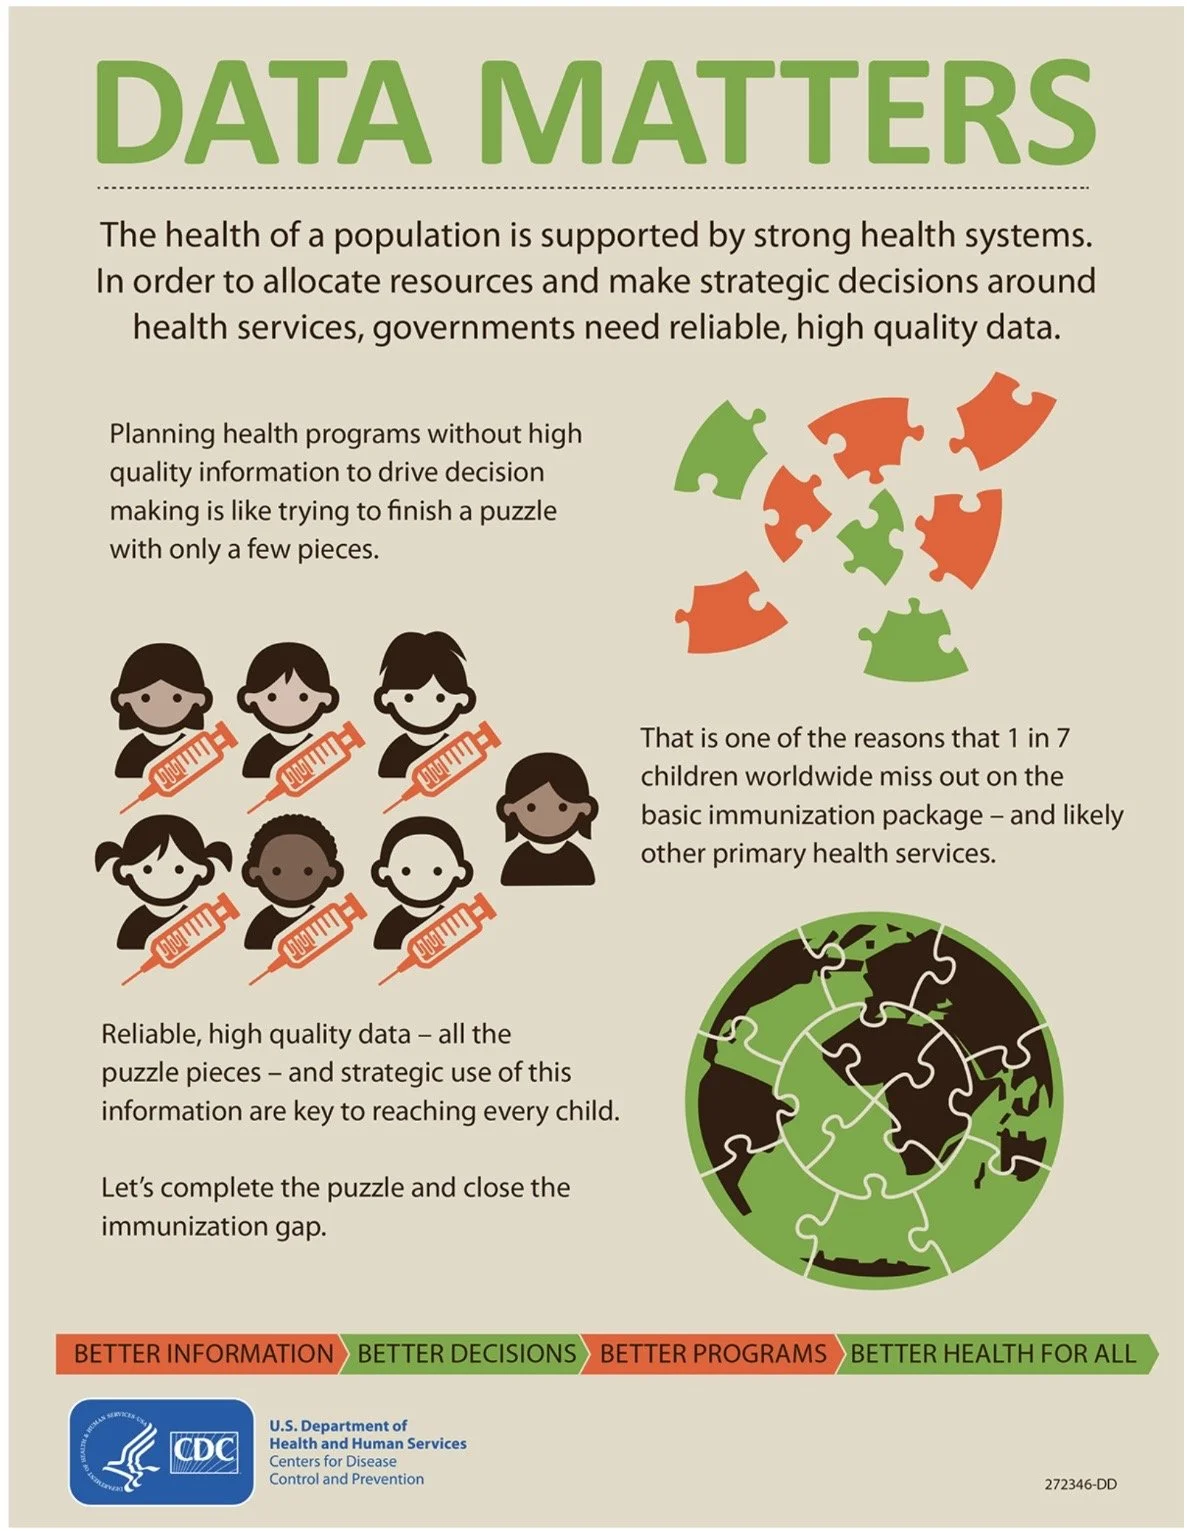
This infographic uses icons and images to grab readers' attention. Typography is also used similarly to the previous infographics, using bold font to highlight the most important data and font size for emphasis. Hierarchy is again used in the infographic to display the important data first and using the trickle-down effect for more distinct data points
In contrast, a poorly designed inforgraphic can lose a reader’s attention just as quickly a well designed infogrpahic can pull a reader in.
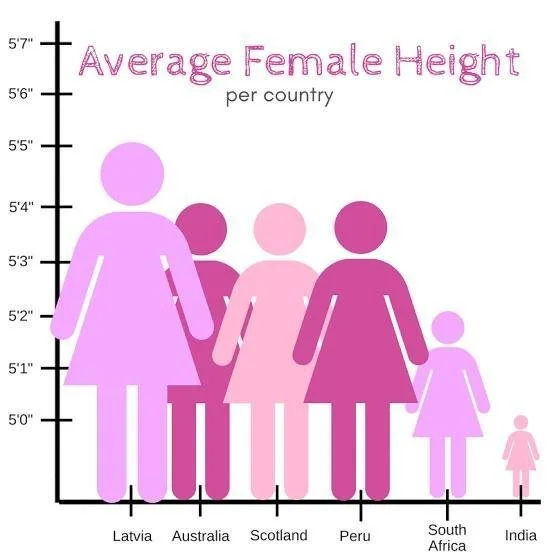
The information displayed in this infographic will be difficult for the reader to comprehend for multiple reasons. The icons are too close together, making the information difficult to understand. If the creator added more space between icons or used a bar graph, the data would be easier to understand. The colors in the graph are also too similar, making the data points blend and making the information harder to understand.
But what makes this information credible and trustworthy? By using sources and proper citations, the information is not only clear and digestible but also backed by verified sources. This will allow the reader to develop trust as well as minimize the spread of potential misinformation.
By using behavioral economics and design elements like hierarchy, typography, and large numbers, infographics deliver information quickly and efficiently in the digital age, where people’s attention spans are moving faster than ever.
Sources:
“CDC Global Health - Infographics - Data Matters.” Centers for Disease Control and Prevention, Centers for Disease Control and Prevention, 6 July 2017, archive.cdc.gov/www_cdc_gov/globalhealth/infographics/data_matters.htm
“Infographic: By the Numbers - Version a.” Centers for Disease Control and Prevention, Centers for Disease Control and Prevention, www.cdc.gov/global-health-protection/php/resources/dghp-by-the-numbers-A.html Accessed 19 Sept. 2026.
“Infographics - Health, United States - Products.” Centers for Disease Control and Prevention, Centers for Disease Control and Prevention, 18 Jan. 2023, www.cdc.gov/nchs/hus/spotlight/2020-Dental.htm
Lupton, Ellen. Design Is Storytelling. Cooper Hewitt, Smithsonian Design Museum, 2021.
